Loading Russian/Cyrillic shapefiles
Several iGIS users are having trouble loading Russian language shapefiles. The trick is to get the right character set. The character set that we’ve had most luck with is ‘Eurpopean Languages – CP1251’ or ‘Windows Cyrillic – CP1251’. Not obvious but it works for at least some datasets.
Loading and using Raster Imagery
To add imagery in iGIS, you must first make your imagery available as a tile set, similar to Google map tiles.
MapTiler converts many image formats into a series of tiles, similar to the Google map tiles. We then use these tiles in iGIS as an overlay on the map, allowing us to retain great map speed, since iGIS doesn’t have to re-project to re-process any imagery.
Several steps are involved in getting your imagery onto iGIS, however once you have been through the process a first time, you should find these steps simple to replicate and well worth the effort.
- Install the MapTiler software on your PC or Mac – only needed the first time.
- Re-project and tile your maps using MapTiler.
- Zip up the resulting imagery directory.
- Copy the zip file to the iPhone using USB.
- Add the layer to the map.
To install MapTiler, please download from maptiler.com and follow the instructions on the web site to install.
Once you have the software installed on your Mac or PC. Follow the wizard interface. I’ve provided the settings that I’ve used below.
Chose Standard Tiles – that’s what we’re using.

Choose the file that you wish to convert.

If your imagery is geo-referenced you should see projection information in this screen. Otherwise you may have to define the geo-referencing information yourself using the ‘Change’ button.

The Zoom Levels are automatically calculated, however you may have to zoom the may in or out to see the imagery. You can always reduce the minimum or increase the maximum zoom to see the imagery at more scales.
Choose a folder as output. Press Render to start creating image tiles.

Once the rendering is complete, which may take a long time depending on the size of your imagery, it is a good idea to test the results, by clicking View the map.
You will see that a directory has been created with several sub-directories. Have a look at the images in the directories to see what the tiler has done.

You need to zip or compress the directory that Map Tiler created. On a Mac use Compress on a PC you can use a free zip utility, like 7 Zip.

Start iTunes with your iPhone connected, and bring up the File Sharing section under the Apps section on your device. See Help on Import for more information. Add the zip file you created and this will automatically sync to the iPhone.
Go into Import mode on your iPhone and the imagery will appear.
Select your image and press Import.

Now edit your Project settings and choose Add Layer. Select the Imagery layer type.

Add the image that you have just created.

Go to your project, pan and zoom to your imagery in the map. Hopefully you see the imagery perfectly aligned to your other data.
Note: The project extent button may not automatically zoom to image bounds. You will have to manually pan and zoom.
I hope that you’ve been able to follow this tutorial. Please contact us if you have any queries and I hope that you enjoy using iGIS with your own imagery.
www.maptiler.org
iGIS support for MapInfo Professional Users
Whilst iGIS currently only supports the import and export of spatial data in ESRI’s shapefile format, MapInfo Professional users do not need to miss out on all the fun, as they can easily utilise their softwares built in Universal Translator tool functionality to convert MapInfo TAB datasets to and from ESRI Shapefile datasets.

Support for conversion from MapInfo TAB files to ESRI Shapefiles;

Support for conversion from ESRI Shapefiles to MapInfo TAB files;

Custom Data Entry Forms
UPDATE: There is a newer version of this article. Please see Custom Data Entry Forms
With iGIS you are able to design your own customized data entry forms, making data entry so much easier. What you can do with customized forms is:
- rename form fields to be more readable,
- set default values for fields,
- add a help prompt,
- use a date/time picker,
- use code lists to select from a set of values with readable text
You define the format of the data entry form in an XML file, which is imported along with the data. This file is of type .glc and have the same name as the shapefile.

The .glc file defines information for each shapefile attribute so that a nice data entry form can be produced.
To start using customized forms, we recommend that you follow the following steps:
- Step 1. Download the below linked sample glc shapefile data and become familiar with the format by; investigating the file in a text editor, importing it into iGIS, editing the shapefile in iGIS.
- Step 2. Use the data export to create a *.glc template for your own shapefile data.
- Step 3. Edit your iGIS created *.glc template file with a text editor to add lookup code lists. Use the sample *.glc file from step 1 as a syntax reference.
- Step 4. Import your shapefile into iGIS with your *.glc file, and begin editing your data with codelists.
Sample Form
We’ve produced a sample .glc file which is available here; FieldPoints2.zip
Use these samples to create your own customized forms. The sample data entry form is:

Exporting .glc Files
You can export .glc files by using the Data Export screen
Reference Information
What field types are supported for iGIS *.glc files?
A full listing of supported field types can be found here; All supported field types
Readable Names
Instead of seeing the shapefile names, which can be truncated, you can show a readable name by using readable-name=”Nice Name”.
Identifiers
You can define an attribute as a unique identifier. this will usually be a number, denoted by the data-type of ‘N’. Set the field-type of ‘AutoIncrement’ to automatically produce the next highest number.
<Attribute column=”Id” readable-name=”Identifier”>

<Value data-type=”N” length=”6″>

<field-type>AutoIncrement</field-type>…
Code Lists
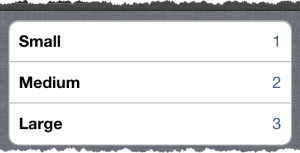
Use code lists to show readable values instead of codes in your forms. For example, the code list below will show ‘Small’ instead of ‘1’ in the form. Note that this code list has a name, in this case ‘SizeCodes’, which will be used by the attributes.
<CodeList name="SizeCodes" type="N" length="1">

   <value code="1">Small</value>

   <value code="2">Medium</value>

   <value code="3">Large</value>

</CodeList>
To use a code list, in the attribute set the field-type to ‘CodeList’ and the field-param to the code list name.
<Attribute column="ShortInt" readable-name="Size">

<Value data-type="N" length="4">

<field-type>CodeList</field-type>

<field-param>SizeCodes</field-param> ...
Default Values and Prompts
For text and number fields, use default to set a default value for the field. If you don’t set a default, you can set a prompt for the field, to aid data entry.
You can’t use both default values and prompts. Default values don’t work with codelists.
Dates
As the date type in shapefiles only hold dates, not times, we recommend that you use a text field to hold dates, which contains both dates and times. Use at least a 25 character field with field-type of ‘Date’. Setting the default value to current will mean that the timestamp is autopopulated when the attribute edit window is invoked in the App.
<Attribute column="Timestamp" readable-name="Timestamp">

<Value data-type="C" length="25">

<field-type>Date</field-type>

<default>current</default>

</Value> ...
Location Services not Enabled
UPDATE: location services have changed in iOS, with further emphasis on privacy. Since iOS 7 or 8, they are now located under Settings>Privacy>Location Services.
If you get the following error from iGIS:
“iGIS could not retrieve your current location or compass direction. The application must be allowed to access your location data for this function to work”
Then make sure you have location services enabled in the Settings app, under General:

Enable location services for your device

Location services must also be enabled for the iGIS application
Why does the iGIS import page not fully load in my internet browser?
The iGIS import page requires Java Applet functionality to be correctly enabled and configured in the web browser you are using.
Please visit the below java.com applet test page to ensure that Java is working correctly;
http://www.java.com/en/download/help/testvm.xml
If the applet does not display properly the page describes additional steps to work through.
If the applet at the page does displays correctly it will return your Java configuration details.

Can I load the shapefiles I export from iGIS into Google Earth Pro?
Yes, however Google Earth pro will only allow you to import shapefiles if they contain an associated projection file (*.prj)
The current version of iGIS does not read or write shapefile *.prj files so you will need to create these with a third-party product or manually with a text editor and the relevant WKT representation text.
For help in discovering your relevant WKT representation text, see the linked site in the below article;
Which EPSG code relates to the projection of my shapefile data?.
Read and write functionality for shapefile projection files may be included in a future iGIS release.

Which EPSG code relates to the projection of my shapefile data?
The below linked website can help with determining which ESRI projections relate to which ESPG codes.
Simply browse to your shapefiles *.prj file, select convert, and the site returns EPSG code(s) and details which match your shapefile projection parameters.
In addition, the below linked EPSG Geodetic Parameter Registry website contains functionality to query EPSG codes by name.

How to perform ping checks in Windows, Linux and Mac OS?
Here are instructions on how to perform a ping check on different operating systems:
- Windows:
1. Open Start menu
2. Click Run
3. Type cmd and press enter
4. In the command prompt type ping domain.com and press Enter
This will provide ping results from your computer to domain.com. You can also use ping with an IP, i.e. ping 1.2.3.4
- Linux:
Open a terminal window and type ping domain.com
- Mac OS:
Go to the Applications folder > Utilities > Network Utility > ping and specify a domain or IP.
Alternatively, you can open up Terminal, type ping domain.com and press Enter. You can also use ping with an IP, i.e. ping 1.2.3.4
source: http://kb.siteground.com/article/How_to_perform_ping_checks_in_Windows_Linux_and_Mac_OS.html

iGIS Features
UPDATE: This article has been updated to reflect new features as of 24-6-16.
True GIS functionality is finally available for the iPad or iPhone! Your data, your maps, your device. Overlaid on satellite and map imagery, you can now import your spatial data and view it wherever you are.
Importing data into iGIS is easy. You can import spatial data using Dropbox, email or via USB on iTunes. Only ESRI Shapefiles (.shp) are supported at the moment.
Your spatial data is stored on the iPad, so there’s no need for an Internet connection to see your data – great for field work. We also support over 3000 projections, so no need for conversion.
We include support for multiple layers or points, lines or polygons – all styled as you like.
You can edit your data also – points, lines and polygons can be added. Track the GPS , use it to set waypoints or touch the screen – there are may ways to capture spatial data with iGIS.
Once you’ve collected the spatial data, you can add attributes in a data entry form. Even better, you can set the format of this form to suit your needs. Code lists, time stamps auto increment fields, default values, field ordering, feild hiding, etc, are supported. All data can be exported as an ESRI shapefile for your use back in your enterprise.
Look at the list of features:
- Unique menu system, with map icons – set your own icon from the map!
- Create lines, polygons and points
- Advanced editing on shape features, even once they have been saved
- Use inbuilt GPS for tracking logs and waypoints.
- Data entry forms can be customized with code lists, timestamps, etc.
- Import and export using ESRI Shapefiles
- Shows current GPS location on iPad + compass.
- Zoom to current location or data extent
- Pan, zoom in, zoom out on maps
- Changeable drawing styles for a layer: size, color, transparency
- Can arrange layer order and turn layers on/off easily
- Can set when a layer is shown using sliders
- Select and interrogate layer information via a point and click
- Shows the selected data on the map
- Show current coordinate in any chosen projection
This application is designed for GIS professionals and an understanding of some basic GIS concepts such as layers, shapefiles, projections etc, would make using iGIS simpler. Please let us know if concepts in iGIS are unclear.
Please let us know what features you’d like to see added or improved.